
Flow Metrics
PCE, lead time and number of handoffs — with every change.
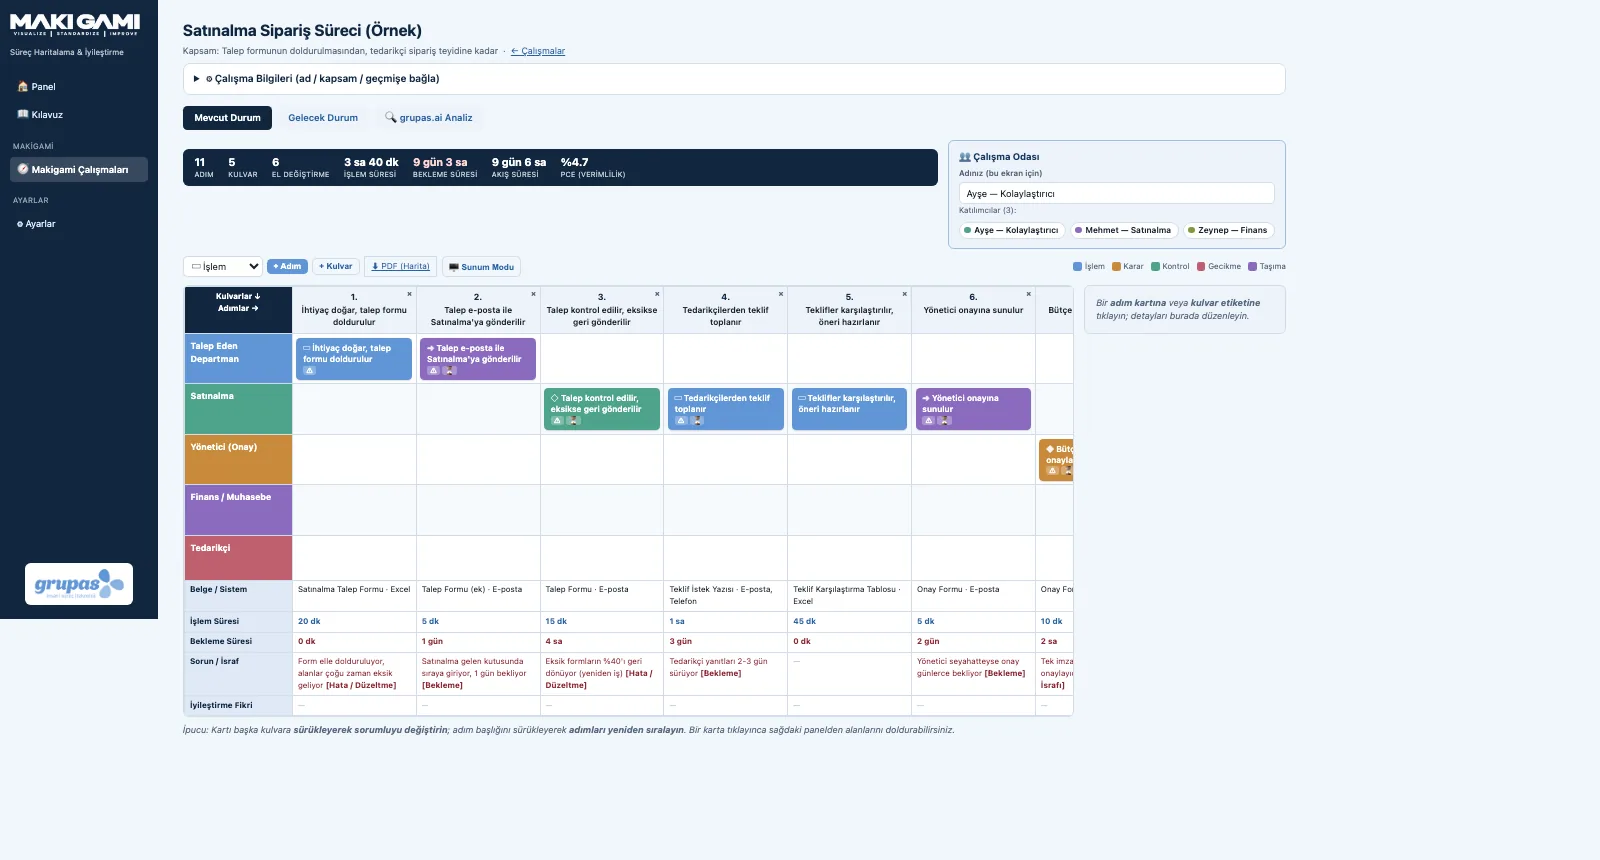
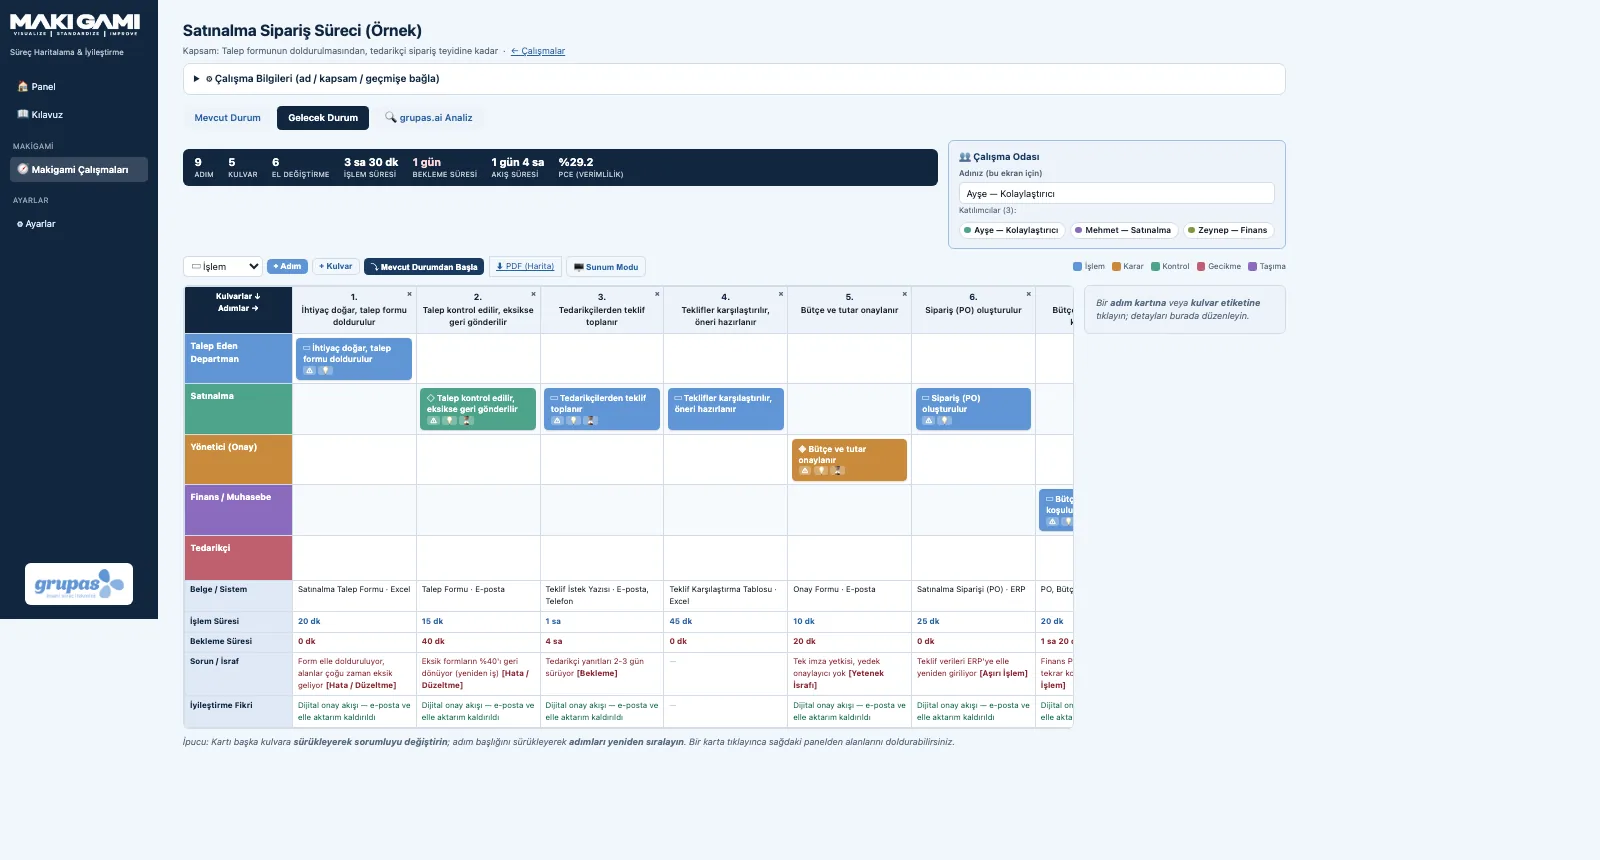
The metrics bar above the map instantly shows the number of steps and lanes, handoffs, total processing and waiting time, lead time and process cycle efficiency (PCE).
What you gain with MAKI GAMI
- Current- and future-state metrics are calculated separately.
How it works
Read the numeric picture of the process with the map.
-
1
Read the metrics bar
Steps, lanes, handoffs, processing / waiting / lead time and PCE sit right above the map, current with every change.
-
2
Compare with the future state
The same metrics are recalculated on the future-state map; the change in waiting and PCE reads directly.
Screens are shown with sample data; the application interface is in Turkish.
Purpose
To show in numbers how much time is real work and how much is waiting, and how many times the work changes hands.
Features
- Lead time = processing time + waiting time
- PCE = total processing time ÷ total lead time
- Handoffs: counted automatically when consecutive steps sit in different lanes
- Problem and idea counts, bottleneck step
Benefits
- Turns invisible waiting into a number
- Measures handoff risk
- Before / after comparison becomes easy
Who uses it
Process owners, managers, operational excellence and digital transformation teams.
All features
See your office process in MAKI GAMI
Write to us for a live walkthrough on sample data.
Request a demo